Using Google Analytics segments to get a better understanding of who your visitors and supporters are can be a great help in knowing what type of experience to give them plus very useful for your marketing team to get more of the right ones through the door.
A good starting point is to identify the types of behaviours you want more of, such as donations, sales, event sign ups, newsletter sign ups, brochure requests, whitepaper downloads etc. We can then create segments around these behaviours and use them to create profiles of the people doing them.
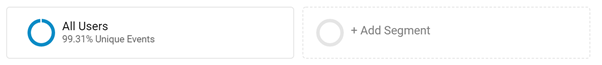
Google’s demo Analytics account has a Goal for when people register so we can create a segment based on this. Above most reports there is an All Users segment automatically applied, click on the Add Segment option next to it.
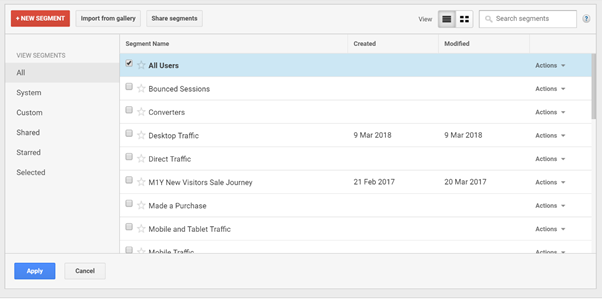
A window opens up with all currently available segments, Analytics provides you with some by default. Click on New Segment.
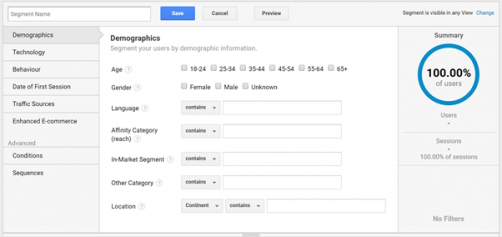
This is where we’ll create our new segment to only look at people who have registered on the site.
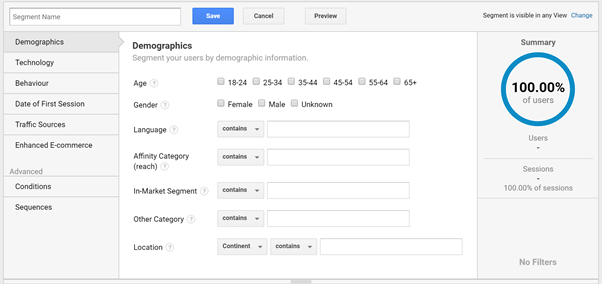
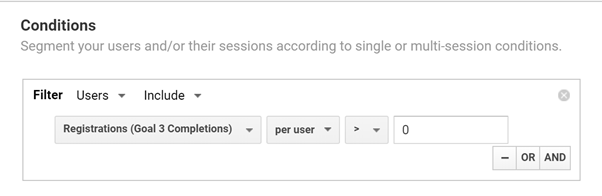
The top 6 options come with predefined options which you can select from. You can use as many as you wish, they all work with an AND condition so the more you select the smaller the sample size you will have to work with. In this example we are going to use Conditions in the Advanced section. You have more options here; every dimension and metric are available, you can change whether you want to look at behaviours on a session or user level and whether you want to include or exclude them.
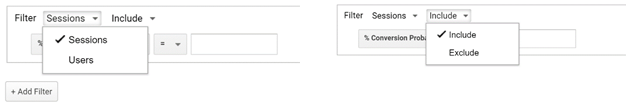
In this example we are going to include users who have greater than 0 registration goal completions.
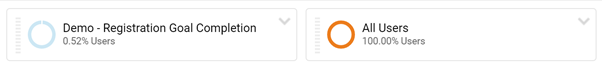
We are now ready to use this segment on different reports to create a profile of people who have registered. We are using this segment side by side with the All Users one to give us context as to how registered users compare to the site average. As we move through the reports these segments will follow us.
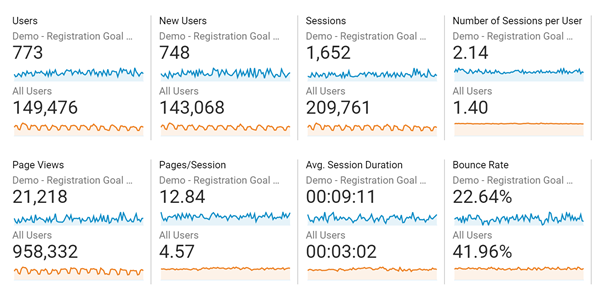
Starting with the Audience Overview we can see Registered Users are more engaged than All Users with a higher number of sessions per user, pages / session and average session duration. We definitely want more registered users.
Audience > Mobile > Overview shows that 63% of registered users visit the site on a mobile vs. 29% of All Users. This highlights that it is crucial it is easy to sign up and use the site on a mobile.
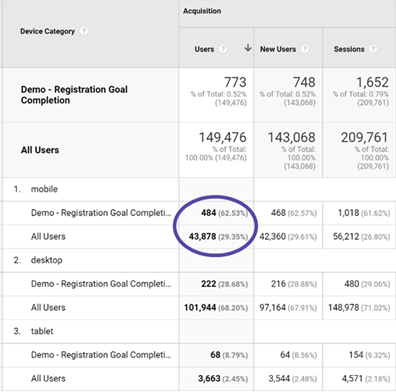
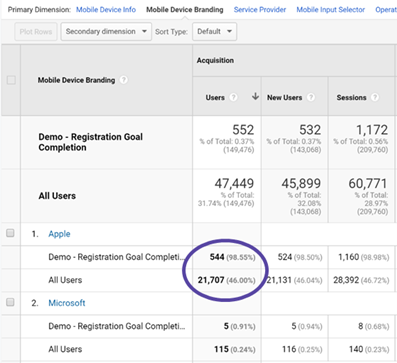
In Audience > Mobile > Devices > Mobile >Device > Branding we can see that of these mobile and tablet users 99% use Apple devices, compared to 46% of All Users.
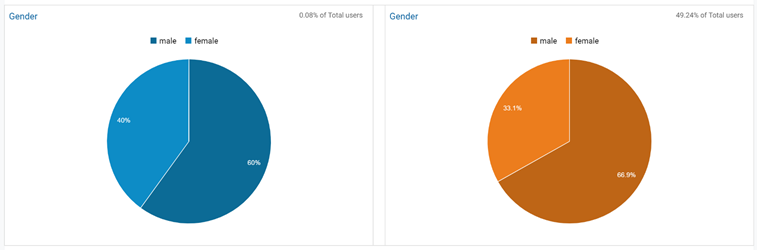
In Audience > Demographics > Overview the majority of Registered Users are male. There is a higher proportion of females than compared to All Users though. Demographic information is only gathered on some visitors so it is important to check the % of Total users in the top right of the chart to determine if the sample size is usable or not. In this case it’s only 0.08% of Registered Users and so isn’t reliable enough to use in our profile.
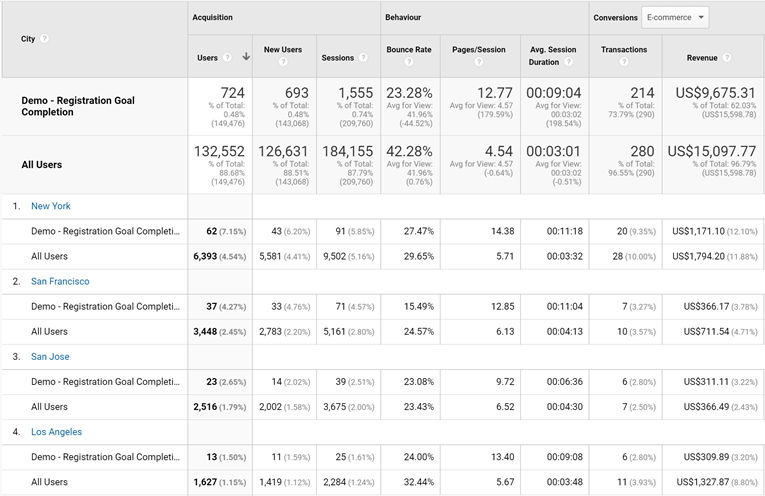
Moving on to Audience > Geo > Location > City registered users are more likely to come from New York, San Francisco or San Jose.
This is just a cursory glimpse of what’s possible using these Google Analytics segments. Already we’ve seen that registered users like Apple and are more likely to come from New York or San Francisco. Therefore, the site has to work well on iOS and Safari. The marketing team can optimise campaigns based on device and location.
We have only skimmed the surface of what is possible to better understand who is performing the actions you want. Another example could be to have a segment of people who donate next to a segment of people who don’t. See if there are any stand out differences, such as the content they look at and marketing they come from. Give yourself some time to play around and see what comes up.
To see how we can help you better understand your supporters/customers take a look at our Customer Profiling Solution
You can find the support guide on Google Analytics segments here
